
Diagnostic Cardiac Tests
Cardiology Editors: Patrick Connolly, MD; Carlos Ortega, MD; David Ray, MD
Faculty Editor: Aniket Rali, MD
Approach to the ECG
Ryan Pohlkamp
Method = Approach each EKG the same way every time
Measurements: 1 “large box” = 200 ms or 0.5 mV, 1 “small box” or 1 mm = 40 ms or 0.1 mV
Rate
- Regular rhythms = “Rule of 300” = 300 ÷ (large boxes between QRS complexes).
- 1 box = 300 bpm, 2 boxes = 150 bpm, 3 boxes = 100 bpm, 4 boxes = 75 bpm, 5 boxes = 60 bpm, 6 boxes = 50 bpm.
- Irregular rhythms or severe bradycardia = (total #of QRS complexes on ECG) x 6.
Rhythm
- Determine regular vs irregular: march out QRS complexes.
- Criteria for Sinus rhythm: P before every QRS; Upright P in Lead I, II; Negative in aVR.
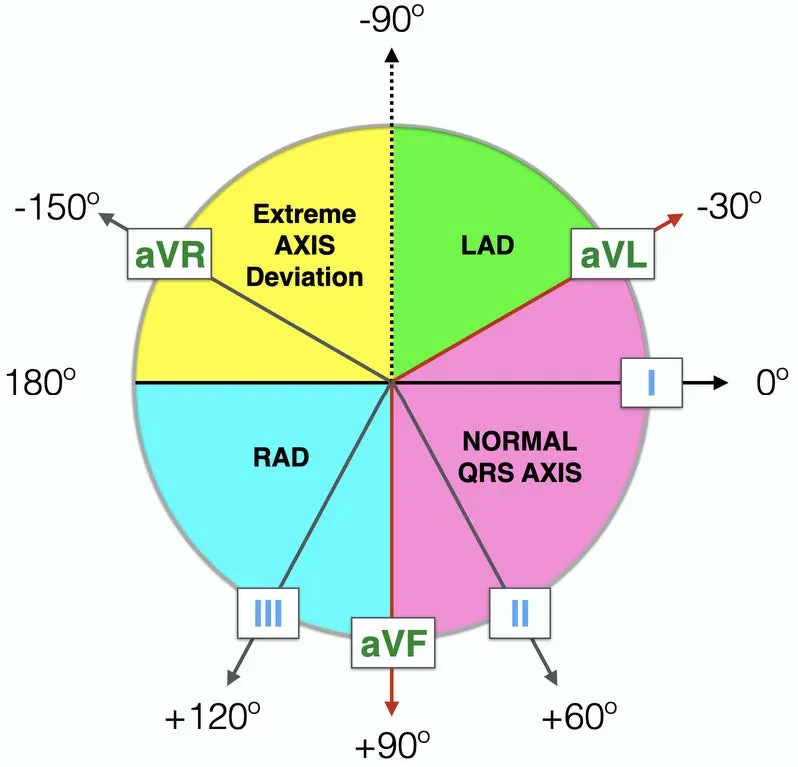
Axis
- Normal: - 30o to + 90o.
- Quick method: Leads I and aVF.
- Normal Axis: Upright in I and aVF (note misclassifies 0 to –30o as LAD).
- Left Axis Deviation: Upright in I, down in aVF.
- Causes: LVH, LBBB, left anterior fascicular block, prior
inferior MI.
- Causes: LVH, LBBB, left anterior fascicular block, prior
- Right Axis Deviation: Down in I, up in aVF.
- Causes: RVH, Left posterior fascicular block, prior lateral MI, PE.
Intervals
- PR Interval: normal 120 – 200 ms.
- If < 120 ms, consider pre-excitation with accessory pathway (i.e. WPW).
- If > 200 ms, first degree AV block
- QRS Complex: 60 – 100 ms (normal).
- 100-120 ms: Incomplete BBB or non-specific intraventricular conduction delay (IVCD).
- > 120ms: complete BBB, ventricular tachycardia, hyperkalemia
- QT interval: Normal duration < 450ms in men and < 460ms in women.
- QT is inversely proportional to HR (QT interval shortens at faster HRs).
- Quick estimate: normal QT is less than half the preceding RR interval.
- QTc estimates the QT interval at a HR of 60 bpm (to allow for comparison across HRs).
- QTcB= most commonly used due to simplicity, most accurate HR of 60.
- QTcF= more accurate when HR is outside the range of 60-100.
- Clinically significant when generally QTc > 500 ms.
- Causes of Prolonged QTc: hereditary, medication-induced (anti-emetics, ABX, psychiatric
meds), hypokalemia, hypomagnesemia, hypocalcemia, ischemia.
Morphology
P Wave
P waves in limb leads should be ≤2.5 small box high and ≤2.5 small box wide.
- Right Atrial Enlargement: Peaked P Wave in Lead II that measures >2.5mm.
- Left Atrial Enlargement
- Lead II: Bifid P Wave (two humps) with total duration > 110 ms.
- Lead V1: Biphasic P wave, terminal deflection > 1mm wide and deep.
- If ≥ 3 different P wave morphologies in same lead: wandering atrial pacemaker (HR < 100) or multifocal atrial tachycardia (HR > 100).
QRS complex
Voltage
- Low voltage: QRS amplitude < 5mm in limb leads or < 10mm in precordial.
- Causes: pericardial effusion, infiltrative cardiomyopathy, obesity.
- Right Ventricular Hypertrophy: Tall R Waves in V1 (> 7mm) and right axis deviation.
- Left Ventricular Hypertrophy: multiple criteria exist.
- Sokolow-Lyon criteria is a common example: S in V1 + R in V5 or V6 >35 mm, R in aVL >11 mm.
- Conduction delays
- RBBB: Wide QRS and RSR’ in V1 or V2; deep broad S In lateral leads.
- LBBB: Wide QRS, large S in V1, broad monophasic R wave in lateral leads (I, aVL, V6).
- R wave progression
- R wave normally gets progressively larger from V1 to V6.
If the transition does not occur by V4, this is called "poor R wave progression." This is seen in chronic lung disease, LVH, left anterior fascicular block, and anterior MI.
- R wave normally gets progressively larger from V1 to V6.
Q-wave: Small Q waves are normal in most leads.
- Pathologic Q waves: > 1 box wide and 2 boxes deep or > 25% height of R wave.
ST Segment
- ST Elevation
- STEMI, LBBB (ST elevation in leads with deep S waves), LVH, Ventricular paced rhythm, Pericarditis (associated with PR depression), coronary vasospasm, Brugada syndrome.
- ST Depression
- Ischemia, reciprocal change in STEMI, posterior myocardial infarction (V1-V3), digoxin, hypokalemia.
- See ACS section for STEMI criteria, Wellens Syndrome
T wave
- Normal T waves are upright in all leads except aVR and V1.
- Inverted T Waves
- Acute ischemia (if present in contiguous leads), LBBB (in lateral leads), RBBB (V1-V3), LVH (‘strain’ pattern similar to LBBB), RVH (RV ‘strain’ in V1-V3 or inferior leads), PE (right heart strain or part of S1,Q3,T3), intracranial pathology.
Peaked T Waves
- Hyperkalemia vs ‘hyperacute’ T waves that precede ST elevation and Q waves in STEMI.